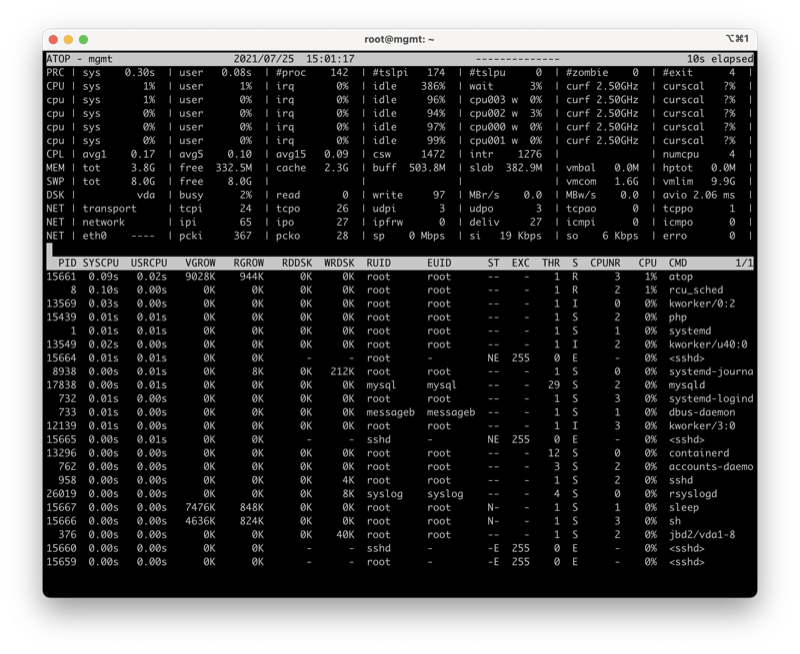
Atop command shows detailed information about used memory, cpu, drives and network information. It’s providing more information than top or htop command.
To run atop, make sure you have installed it already on your OS:
Debian/Ubuntu #
$ sudo apt install atop
CentOS: #
$ sudo yum install atop
Run atop #
$ sudo atop
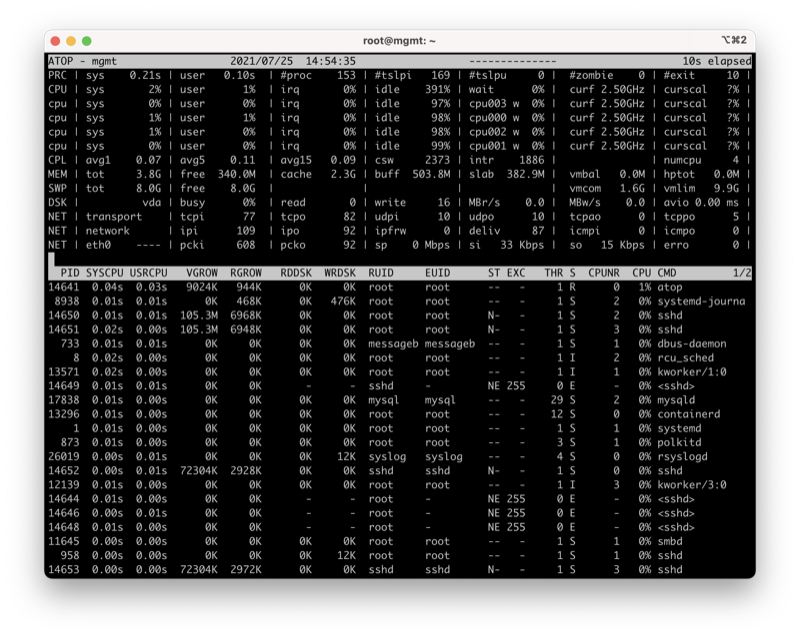
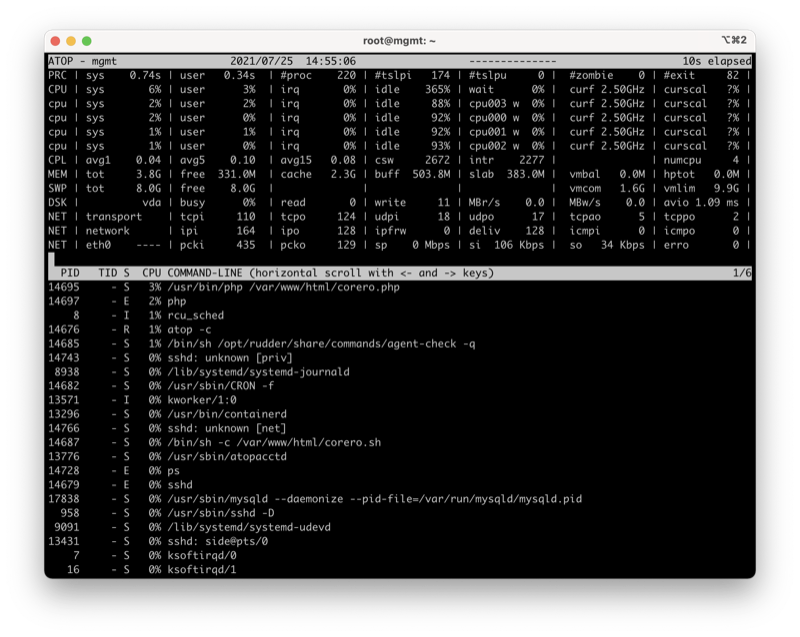
Show CPU usage #
$ sudo atop -c
Show memory usage #
$ sudo atop -m

Show disk utilization #
$ sudo atop -d
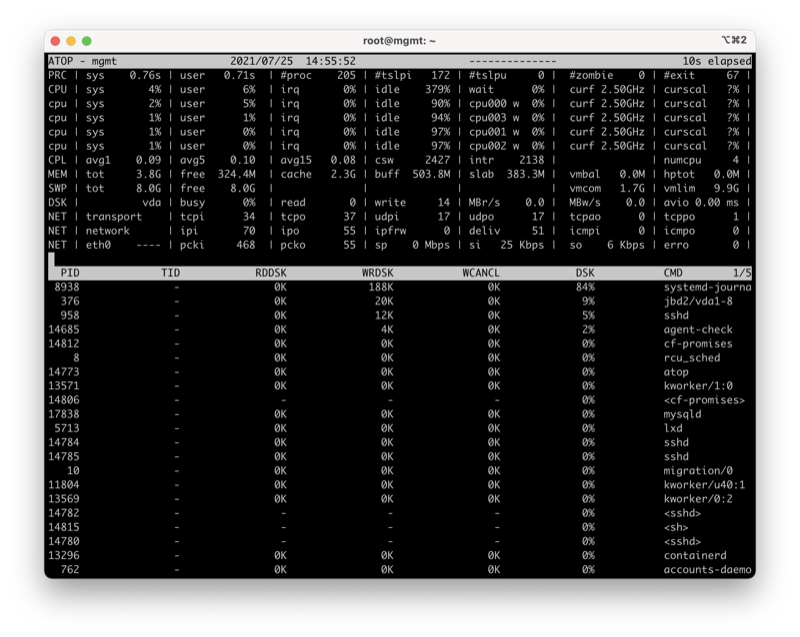
Where:
RRDSK shows read disk
WRDSK shows write disk
DSK shows general disk usage
CMD shows related command
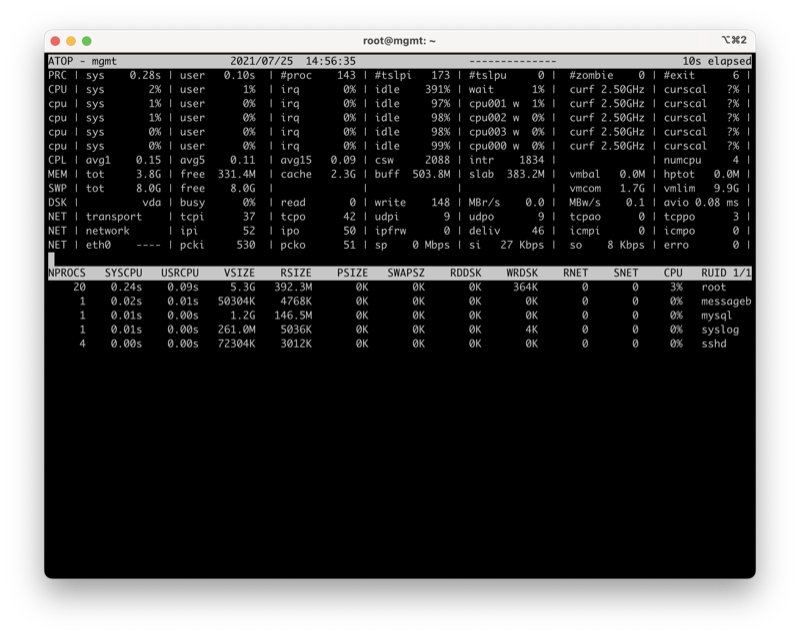
Display process information #
$ sudo atop -p

Where:
SYSCPU display system side CPU usage
USRCPU display user side CPU usage
VSIZE display virtual memory size
RSIZE display real memory size
RDDSK display disk read
WRDSK display disk write
RNET display network receive
SNET display network send
CPU display shortcut
CPU usage percentage
CMD display related command
Display process information according to user #
$ sudo atop -u
Show generic information #
$ sudo atop -g
It shows the following information #
PID process ID
EUID
USR CPU User level CPU usage
CPU CPU usage
RDDSK Read disk
WRDSK Write to disk
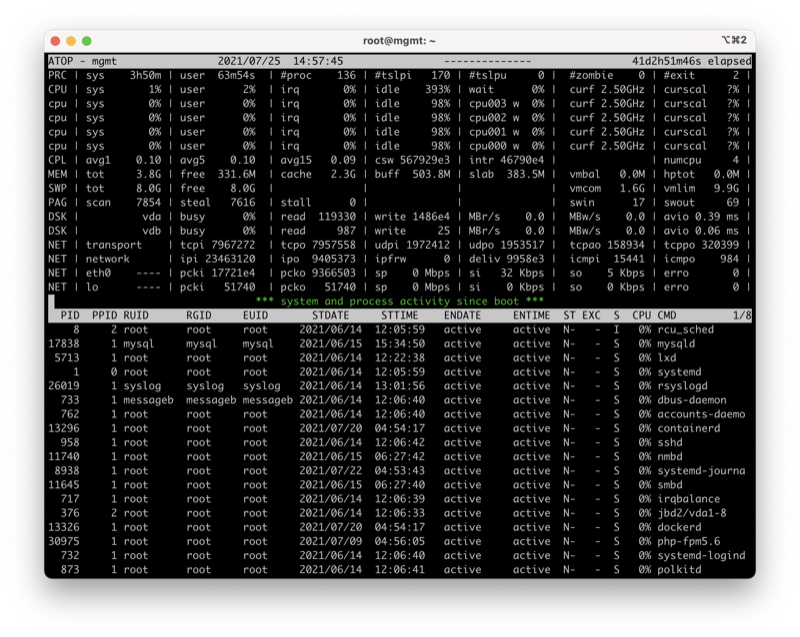
Show active processes #
$ sudo atop -a

Verbose mode #
$ sudo atop -v
Display threads #
$ sudo atop -y


